iDRAC 9 Diagnostics
The iDRAC web interface confuses me, so I noted where to find the diagnostic commands.
Use this path through the drop-down menu at the top of the window:
Dashboard » System » Storage » Configuration » Maintenance » iDRAC Settings
The Diagnostics Console Command is under Maintenance and Diagnostics.
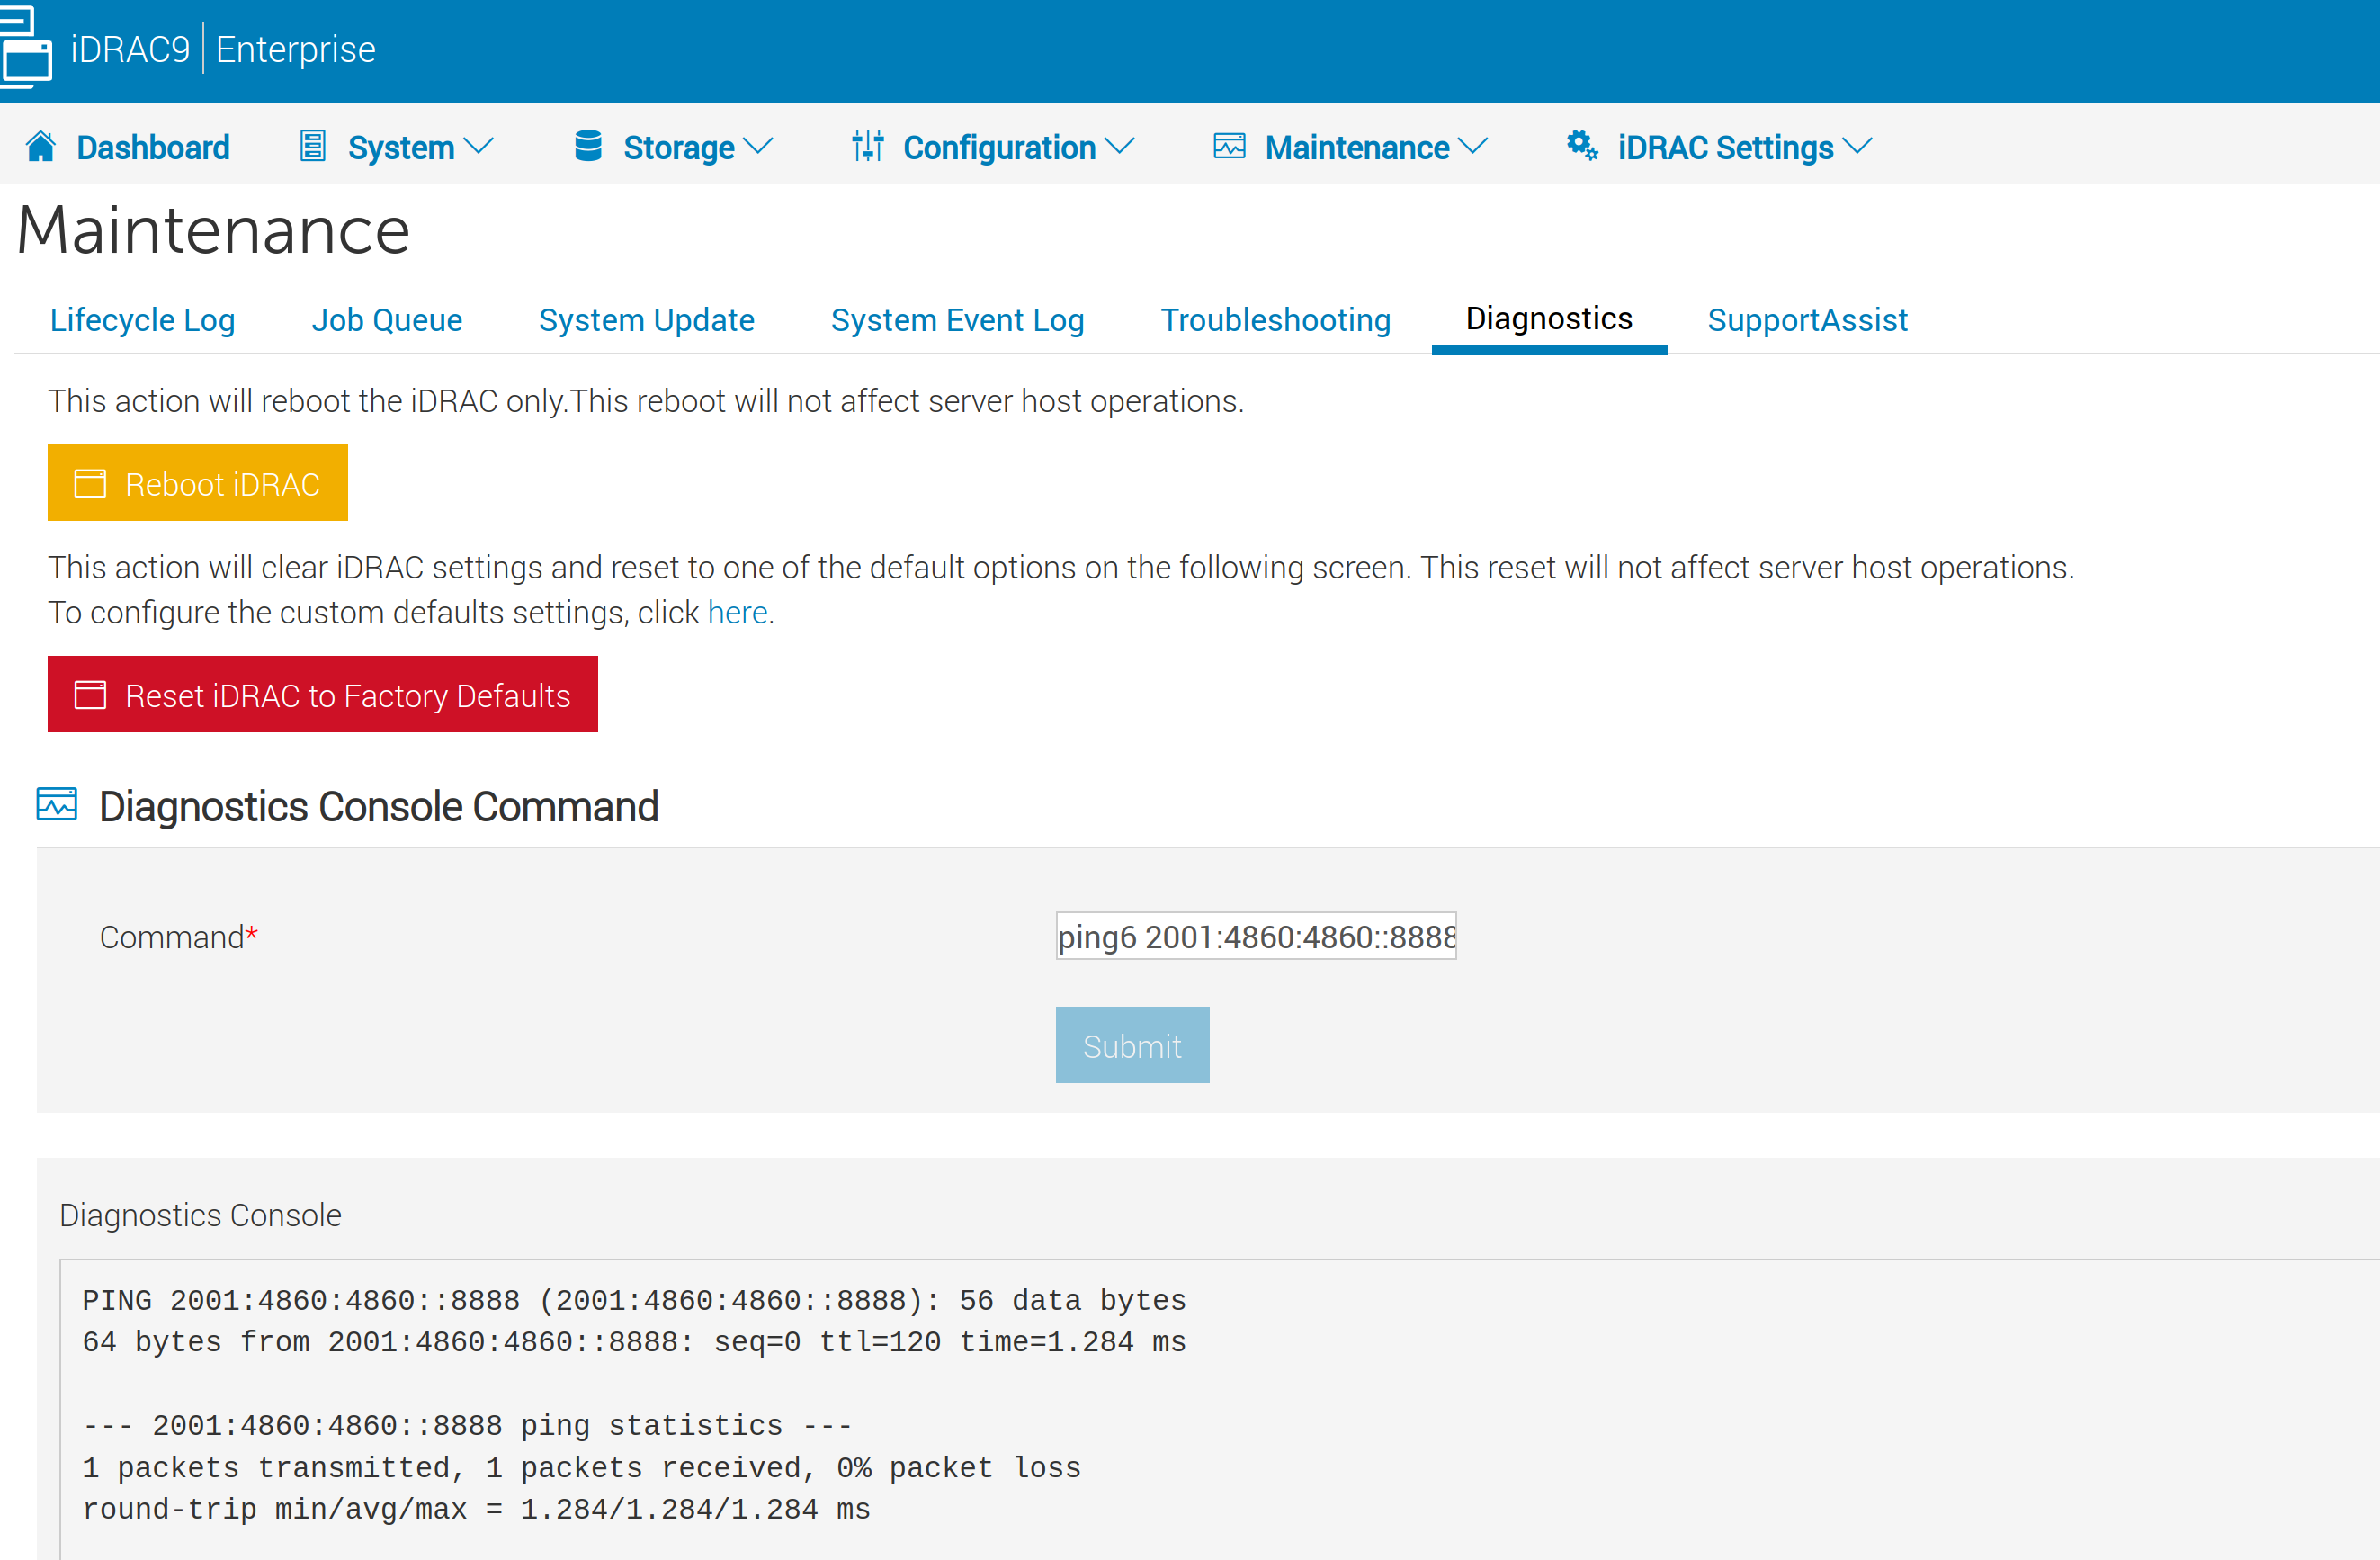
The commands are:
arp
usage: arp
Displays the ARP table. In my case:
fe80::abcd:xxxx:xxxx:abcd dev bond0 lladdr 12:xx:xx:xx:34
fe80::abcd:xxxx:xxxx:abcd dev bond0 lladdr 12:xx:xx:xx:34 router REACHABLE
or:
fe80::abcd:xxxx:xxxx:abcd dev bond0 lladdr 12:xx:xx:xx:34 router DELAY
Whether it is REACHABLE or DELAY doesn’t matter much. More on ARP here.
ifconfig
Displays info about a network interface.
usage: ifconfig
bond0     Link encap:Ethernet  HWaddr F4:EE:08:XX:XX:XX
          inet6 addr: 2001:718:1:fff0:XXXX:XXXX:XXXX:XXXX/64 Scope:Global
          inet6 addr: fe80::f52c:2f7d:XXXX:XXXX/64 Scope:Link
          UP BROADCAST RUNNING MULTICAST  MTU:1500  Metric:1
          RX packets:1749 errors:0 dropped:0 overruns:0 frame:0
          TX packets:2801 errors:0 dropped:0 overruns:0 carrier:0
          collisions:0 txqueuelen:1000
          RX bytes:3259327 (3.1 MiB)  TX bytes:1492890 (1.4 MiB)
netstat
usage: netstat
Displays the routing table:
Kernel IPv6 routing table
Destination                                 Next Hop                                Flags Metric Ref    Use Iface
::1/128                                     ::                                      Un    0      5        0 lo
::1/128                                     ::                                      U     256    1        0 lo
2001:xxx:1:xxxx::/64                        ::                                      UA    256    2        0 bondX
fe80::xxxx:xxxx:xxxx:xxxx/128               ::                                      Un    0      3        0 bondX
fe80::/64                                   ::                                      U     256    1        0 bondX
ff00::/8                                    ::                                      U     256    4        0 bondX
::/0                                        fe80::xxxx:xxxx:xxxx:xxxx                UGDA  1024   2        0 bondX

Active Internet connections (w/o servers)
Proto Recv-Q Send-Q Local Address           Foreign Address         State
tcp        0      0 127.0.0.1:xxxxx         127.0.0.1:4xxx          TIME_WAIT
tcp        0      0 127.0.0.1:xxxxx         127.0.0.1:4xxx          TIME_WAIT
tcp        0      0 127.0.0.1:xxxxx         127.0.0.1:4xxx          ESTABLISHED
tcp        0      0 127.0.0.1:xxxxx         127.0.0.1:4xxx          TIME_WAIT
tcp        0      0 2001:xxx:1:xxxx::xxxx:xxxx  2001:xxx:1:x::xx:xxxx  ESTABLISHED
tcp        0      0 ::ffff:127.0.0.1:443    ::ffff:127.0.0.1:xxxxx  ESTABLISHED
This line is the interesting one:
::/0 fe80::xxxx:xxxx:xxxx:xxxx UGDA 1024 2 0 bondX
The IPv6 address after ::/0 is the default gateway. The UGDA flags mean:
U - the route is up
G - the route is to a Gateway
D - it’s Dynamically created (by a routing daemon or DHCP)
A - it’s installed by an ICMP redirect (by the router)
ping and ping6
usage:
ping6 2001:4860:4860::8888
ping 1.1.1.1
These commands verify connectivity to a destination address.
gettracelog
Shows a log of network communication. It wasn’t as helpful as I hoped when I had DNS issues.